

Weekly Technical Analysis Update - 16th September 2023
Weekly Technical Analysis Update - 16th September 2023
An Introduction to Technical Analysis For Beginners, and The Weekly Chart Deck

Introduction To Technical Analysis
Let me explain some of the basics for those with little understanding of technical analysis.
Technical analysis uses chart data of historic prices, volumes, and other mathematical indicators to determine trends and patterns. These can then be used to attempt to predict where the price is heading next.
A key market principle is that fundamental analysis (economic and financial factors) drives the long-term price movement of an asset. But in the short term, sentiment (overall feeling) and technicals reign supreme. For swing trading (open for a few days to a few weeks), technical analysis is a great method to implement into your trading system.
The stock market is a wonderfully complex system. It is a collection of every participant’s opinions and beliefs. An asset price reflects the full information available to the entire cohort of market participants. However, some of these participants aren’t rational, or may not have access to full information on an individual level. Hence we can’t use these techniques of analysis to 100% accurately predict the stock market, and we never will be able to.

The indicators I use are as follows:
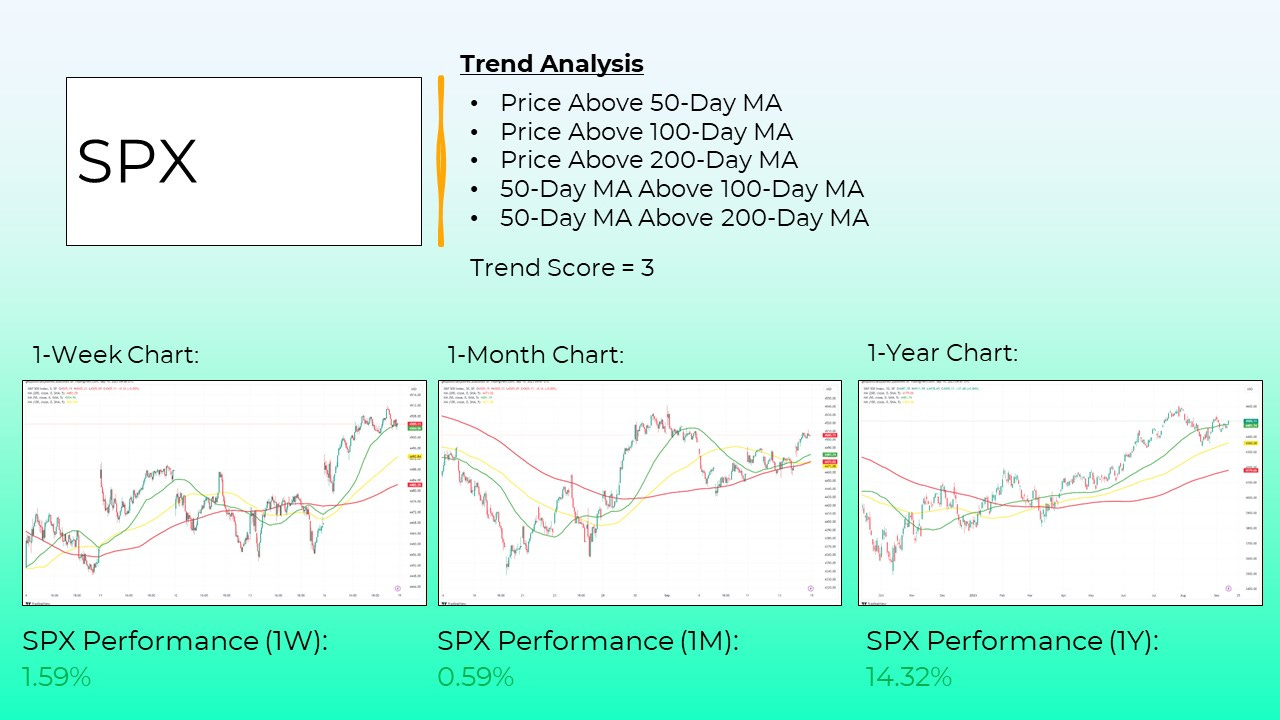
Moving Averages - Help to smooth out price data by taking averages of a specific number of periods of price. For example, a 20-period moving average will take an average of the last 20 periods of prices. You can choose if you want these prices to be the open price, the close price, the high price or the low price per period. The period will depend on the time frame that you view the asset. The indicator is represented by a line on your chart. In my algorithm, I use the daily chart, and the 50-day, 100-day, and 200-day simple moving averages. There exist other types of moving averages. If you’re so interested, head over to your chosen charting software and mess about.
Bollinger Bands - Before explaining what Bollinger bands are, I’ll explain a mathematical concept that they rely on. A standard deviation measures how much your dataset varies by in a certain time period. On average, it tells you how far each value in your calculation sits from the mean. A high value means your prices are falling far from the mean. Some believe that in the stock market, financial assets return to the mean over time. However, this can be a long time. This is why bubbles exist, and why assets can look so depressed in price for such a long time. Markets can stay irrational longer than you can stay solvent, so be wary when investing in the long term. However, for trading, measuring when some assets are spread far from the mean can allow us to determine how much oomph could be left in a trend. The Bollinger bands indicator contains three lines. The middle line is a simple moving average, and the upper and lower lines sit two standard deviations away from this line. A price at the upper line could indicate an overbought asset and a price at the lower line could imply an oversold asset. But not always. As I state in this week’s technical analysis chart deck, consider the angles of the lines in the Bollinger band indicator. An asset could be touching the upper line and appear overbought, but the trend can continue upwards if the upper Bollinger band is also rising.
Support and Resistance Lines - Prices constantly move due to supply and demand. When supply outweighs demand, prices fall. When demand outweighs supply, prices rise. There are sometimes levels where the price always seems to return to and retest. If a price is heading down, it will reach support lines. These lines or zones act as a level of downside protection. If the price bounces off support and heads back up, then the support line is held. If the price travels through a support line, the price could continue the trend and head lower. If the price is heading higher, it could reach resistance lines. These areas are upside protection. If a trend wants to continue upward, it will need to break through these zones. If not, the price could reverse and bounce off the resistance zone, heading back lower.
I also have an algorithm I use for my personal stock market trading. I won’t be divulging what indicators I use in that algorithm. If you want to build your own algorithm, head over to MetaTrader and explore their thousands of indicators.
An alternative source is how I learned about technical analysis. Either the BabyPips online course or No Nonsense Forex, which releases an indicator video weekly.
Sources:
https://www.theforage.com/blog/skills/technical-analysis#:~:text=Technical%20analysis%20uses%20a%20stock,currencies%2C%20bonds%2C%20and%20stocks.
https://www.investopedia.com/terms/b/bollingerbands.asp
https://www.scribbr.co.uk/stats/standard-deviation-meaning/#:~:text=The%20standard%20deviation%20is%20the,clustered%20close%20to%20the%20mean.
https://www.investopedia.com/trading/support-and-resistance-basics/
Weekly Technical Analysis Chartdeck


Keep reading with a 7-day free trial
Subscribe to Geopolitics Explained to keep reading this post and get 7 days of free access to the full post archives.