Geopolitics Review - 9th September 2024
State-Level Analysis of The US Election
Contents
Introduction
Registered Democrats and Republicans By State
Electoral College Swing States
Flipped States Since 2000
Polling and Analysis
Concluding Remarks
Bitesize Edition
Over the last few weeks, I’ve explored the demographics behind the 2016 and 2020 elections in the United States. If you want to find out how ethnicity, age, gender, religion, and education affect voting trends in US elections, head to the Geopolitics Explained home page and search for those.
Today, in what is the more important analysis, I’ll explore the US election on a state level. Of course, the citizens of a country make up the voter base, but a popular vote doesn’t decide who walks into the White House in January. The Electoral College does.
So, what is the Electoral College? Which states are the most unpredictable in this upcoming election? Have any states flipped from Republican to Democrat or vice-versa since 2000 and could this happen again?
Finally, if we take all these states that aren’t considered “safe”, where do we end up in November based on current polling? How much could that polling shift between now and November? Find out more below.
Introduction
In the last few weeks, I’ve explored the demographics behind the United States election. But, as we’ve seen multiple times before, the election isn’t won by the popular vote, it’s won in the Electoral College. Today, I’ll explore the election on a state level. Which states will be vital in determining who enters the White House?
Registered Democrats and Registered Republicans By State
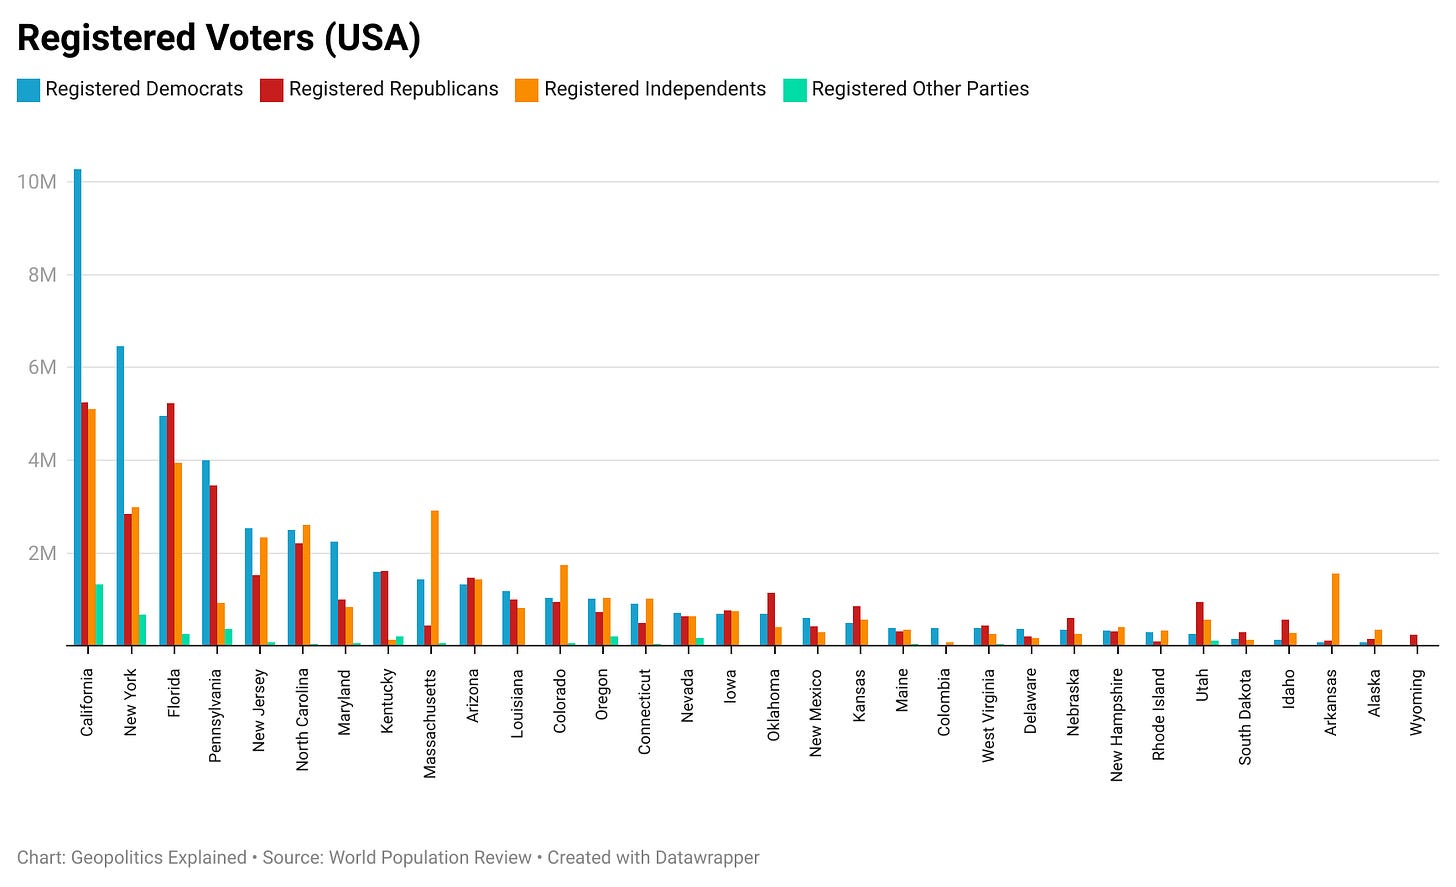
Before moving on to the state analysis, this is another graphic I wish to include exploring registered Democrats, Republicans, and Independents and which states have the highest proportion of voters for which party.
Note: Republicans who vote for Democrat candidates and Democrats who vote for Republican candidates often equate to between 4-6%.
States Not Included: Hawaii, Texas, Mississippi, Alabama, Georgia, South Carolina, Tennessee, Virginia, Missouri, Illinois, Indiana, Ohio, Minnesota, Vermont, Washington, North Dakota, Montana, Wisconsin, Michigan.
Going forward today, I won’t include this data in any further analysis. Consider it as a separate piece. For now, let’s dive into the election on a state level.
Electoral College Swing States
The most important aspect of the election in the United States is turning votes into electoral college votes. 538 are up for grabs, and 270 win the candidate the presidency.
In an individual state, whoever wins the most votes wins all the electoral votes for that state, excluding Maine and Nebraska which use slightly different systems.
Hence, the number of votes attributed to each state is key.
What is also important is where each state usually falls in an election. Most states are strong Democrats or strong Republicans, and so don’t often flip. It’s the swing states where the election will be decided. They are stated below:
Arizona (11 Votes)
Georgia (16 Votes)
Michigan (15 Votes)
Nevada (6 Votes)
North Carolina (16 Votes)
Pennsylvania (19 Votes)
Wisconsin (10 Votes)
New Hampshire (4 Votes)
Virginia (13 Votes)
I include New Hampshire and Virginia as potential swing states while many other analysts don’t. Both are currently polling as Democratic states, but aren’t considered safe by any means.
From this group of swing states remaining unaligned in the prediction, and the other states falling to Democrats or Republicans as predicted in the RoadTo270 scenario, there are 53 winning combinations for the Democrats and 64 for the Republicans. In 12 scenarios, the two parties would tie. This example is seen below.
Keep reading with a 7-day free trial
Subscribe to Geopolitics Explained to keep reading this post and get 7 days of free access to the full post archives.


