


Geopolitics and Markets Review – 6th February 2023
An Actual Market Review?!

A quick note before we start. For those who enjoy the weekly news reviews, I’m still writing them but I post them on Reddit and my website and not the substack. There is a link on the web version of substack but for those on mobile, go to geopoliticsexplained.co.uk. The news articles will be posted in the section under media, and the link to Reddit is included in the links section also.
For a weekly post that is called the Geopolitics and Markets Review, I don’t often do an actual market review. I discuss fundamentals a lot, but technical analysis and related assets are important methods of market analysis also. When analysing my investments, I use the FIPEST method brought to light by David Brady of Sprott Money. It stands for:
- Fundamentals
- Inter-market Analysis
- Positioning (COT Report)
- Elliot Waves
- Sentiment
- Technicals
I discuss fundamentals frequently. The inter-market analysis describes links between assets. For example, gold and silver as precious metals. Positioning is how market participants are positioning themselves, either long or short. Elliot waves are an aspect of technical analysis that I choose to ignore due to it being based on opinions on where they are positioned. The sentiment is always important and tracked through indicators such as the fear and greed index.
Finally, we have the technical analysis. Price levels. The commonly used moving averages. I like to use the most commonly used indicators not because they are the best, but because they allow me to get into the mind of the largest percentage of market participants. To attempt to understand what they’re seeing and how markets could react to different scenarios occurring.
Scenario analysis is a large chunk of work I do when analysing assets and potential futures. If a specific situation does occur, how can I position myself to take advantage of this scenario, and then hedge myself if this scenario doesn’t unfold how I think it will? Just like it's healthy to not fall in love with assets, don’t fall in love with your own theories either. Accept that you could be wrong.
Now, let's break down the technical analysis of the most common assets.
The Overbought Oversold Indicator
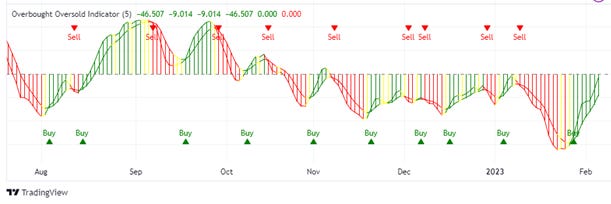
Using this indicator to judge if the price is overbought or oversold, and which direction of trade should be taken. But, don’t trade every signal. This is a zero-line indicator, represented by the dotted line through the middle. To make a buy (bullish) trade, I’d want to receive a buy signal and I’d want the indicator to be above the zero level line, and I’d want the indicator line to be green. To make a sell trade, I’d want to receive a sell signal with the indicator below the zero line and to be red.
Keep reading with a 7-day free trial
Subscribe to Geopolitics Explained to keep reading this post and get 7 days of free access to the full post archives.